Linear Spline Approximation
Contents
Linear Spline Approximation
Randall Romero Aguilar, PhD
This demo is based on the original Matlab demo accompanying the Computational Economics and Finance 2001 textbook by Mario Miranda and Paul Fackler.
Original (Matlab) CompEcon file: demapp09.m
Running this file requires the Python version of CompEcon. This can be installed with pip by running
!pip install compecon --upgrade
Last updated: 2022-Oct-22
Initial tasks
import numpy as np
import matplotlib.pyplot as plt
from compecon import BasisSpline
def f(x):
    return 50 - np.cos(x**2 / 8) * (x - np.pi + .5)**2
xmin, xmax = 0.0, 1.5*np.pi
off = 0.05
xlims = [xmin - off, xmax + off]
n = 401
x = np.linspace(xmin, xmax, n)
y = f(x)
ymin, ymax = y.min(), y.max()
ywid = ymax - ymin
ylims = [ymin - 0.5*ywid, ymax + 0.1*ywid]
figs = []
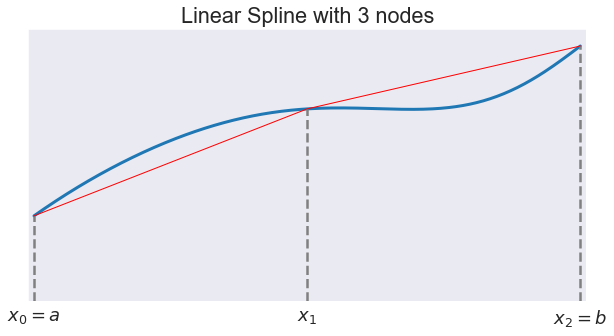
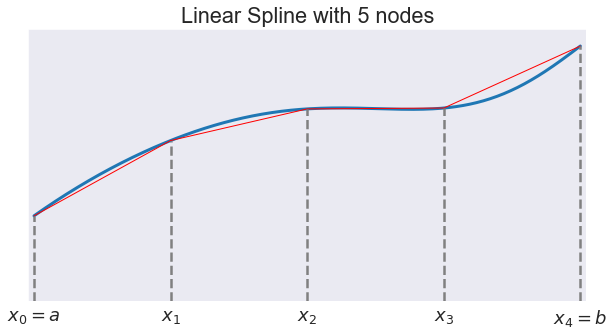
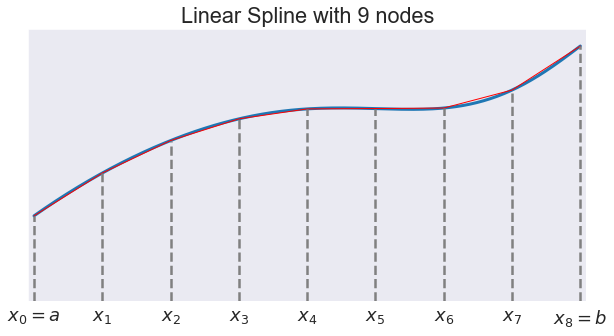
for nnode in 3, 5, 9:
F = BasisSpline(nnode, xmin, xmax, k=1, f=f)
xnodes = F.nodes[0]
xx = np.r_[x, xnodes]
xx.sort()
fig, ax= plt.subplots(figsize=[10,5])
ax.set(title = f'Linear Spline with {nnode} nodes',
#xlabel='', ylabel='',
xlim=xlims, ylim=ylims)
ax.plot(xx, f(xx), lw=3) # true function
ax.plot(xx, F(xx), 'r', lw=1) # approximation
ax.set(yticks=ylims, yticklabels=['', ''])
xe = ['$x_{%d}$' % k for k in range(nnode)]
xe[0], xe[-1] = '$x_0=a$', '$x_{%d}=b$' % (nnode-1)
ax.set_xticks(xnodes)
ax.set_xticklabels(xe, fontsize=18)
for i, xi in enumerate(xnodes):
ax.vlines(xi, ylims[0], F(xi), 'gray','--')
figs.append(fig)