Timber Harvesting – using 2 nodes
Contents
Timber Harvesting – using 2 nodes
Randall Romero Aguilar, PhD
This demo is based on the original Matlab demo accompanying the Computational Economics and Finance 2001 textbook by Mario Miranda and Paul Fackler.
Original (Matlab) CompEcon file: demdp01a.m
Running this file requires the Python version of CompEcon. This can be installed with pip by running
!pip install compecon --upgrade
Last updated: 2022-Oct-22
About
Profit maximizing owner of a commercial tree stand must decide when to clearcut the stand.
import numpy as np
from compecon import NLP
import matplotlib.pyplot as plt
price = 1.0  # price of biomass
κ = 0.2  # clearcut-replant cost
smax  = 0.5  # stand carrying capacity
ɣ = 0.1  # biomass growth parameter
δ = 0.9  # discount factor
Code the growth function
snodes = np.array([0.2, 0.4])
def h(s): return s + ɣ*(smax - s)
SOLUTION
Code the approximant and the residual
def vhat(c, s): return c[0] + c[1]*s
def vhat1(c,s): return price*s - κ + δ * vhat(c,h(0))
def vhat0(c,s): return δ * vhat(c, h(s))

def resid(c,s=snodes): return vhat(c,s) - np.maximum(vhat0(c,s), vhat1(c,s))
Solve collocation equation
cc = NLP(resid).broyden(np.zeros(2))
Compute critical biomass
scrit = NLP(lambda s: vhat0(cc,s)-vhat1(cc,s)).broyden(0.0)
scrit
0.36199999999813565
ANALYSIS
Compute refined state grid
ss = np.linspace(0,smax,1000)
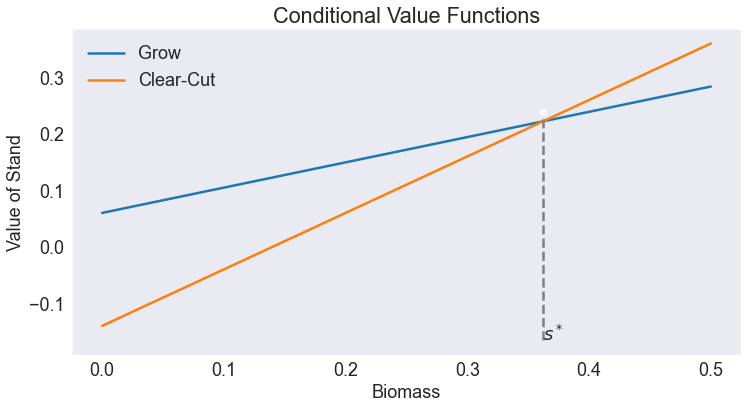
Plot Conditional Value Functions
fig1, ax = plt.subplots()

ax.plot(ss,vhat0(cc,ss),label='Grow')
ax.plot(ss,vhat1(cc,ss),label='Clear-Cut')

ax.set(title='Conditional Value Functions',
       xlabel='Biomass',
       ylabel='Value of Stand')

ax.legend()

vcrit = vhat(cc,scrit)
ymin = ax.get_ylim()[0]
ax.vlines(scrit, ymin,vcrit,'grey',linestyles='--')
ax.annotate('$s^*$', [scrit,ymin])
ax.plot(scrit,vcrit, 'wo')

print(f'Optimal Biomass Harvest Level = {scrit:.4f}')
Optimal Biomass Harvest Level = 0.3620
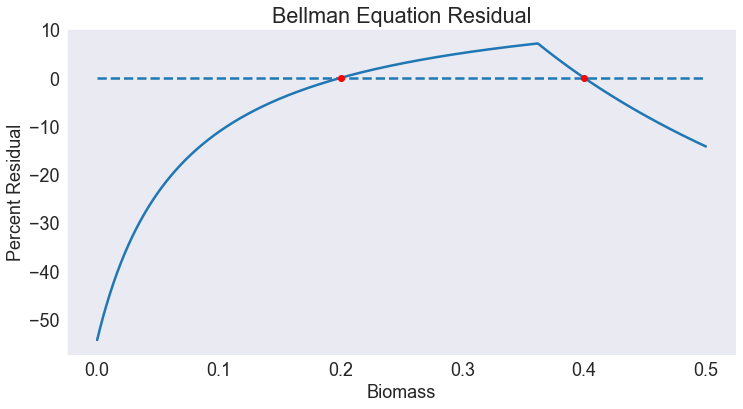
Plot Value Function Residual
fig2, ax = plt.subplots()

ax.set(title='Bellman Equation Residual',
       xlabel='Biomass',
       ylabel='Percent Residual')

ax.plot(ss, 100*resid(cc,ss) / vhat(cc,ss))
ax.hlines(0,0,smax,linestyles='--')
ax.plot(snodes,resid(cc),'ro')
[<matplotlib.lines.Line2D at 0x2b67e422af0>]
Compute ergodic mean annual harvest
s = h(0)
for n in range(100):
    if s > scrit: break
    s = h(s)

print(f'Ergodic Mean Annual Harvest = {s/n:.4f} after {n+1} iterations')
Ergodic Mean Annual Harvest = 0.0311 after 13 iterations