Estimación de un VAR de la política monetaria de Costa Rica
Contents
8.3. Estimación de un VAR de la política monetaria de Costa Rica#
Primeros pasos#
Nota Para ejecutar este cuaderno se requiere el paquete bccr. Si no lo tiene, ejecute la siguiente celda
try:
    import bccr
except ImportError:
    print('Module bccr missing. Installing it now')
    !pip install bccr
from bccr import SW
import numpy as np
import pandas as pd
import matplotlib.pyplot as plt
plt.style.use('seaborn')

from statsmodels.tsa.api import VAR
plt.rc('font', serif=['Computer Modern'])
Descargar datos#
SW.buscar('desempleo abierto', periodo='Trimestral')
| DESCRIPCION | Unidad | Medida | periodo | |
|---|---|---|---|---|
| codigo | ||||
| 22796 | Demográficas y Mercado Laboral/Tasa de desempleo abierto [22796]' | Porcentaje | Unidades | Trimestral |
datos = SW(Desempleo=22796, Inflación=25485, TPM=3541, FechaInicio=2010, func=np.mean, fillna='ffill').dropna()
datos.plot(figsize=[15,5])
<AxesSubplot:xlabel='fecha'>
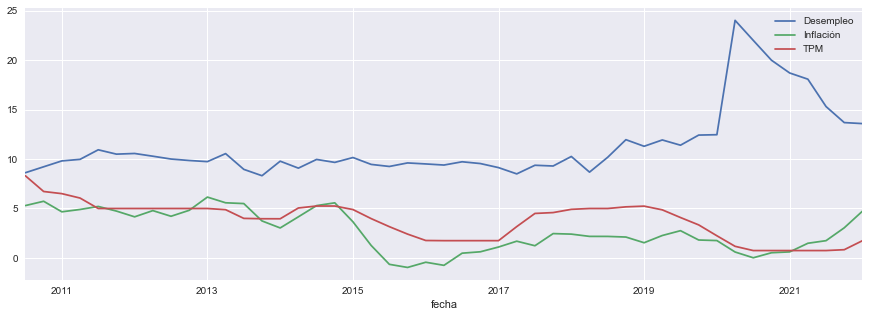
Importante Por fines didácticos, ahora restringimos la muestra a datos hasta el primer trimestre de 2020. El gran aumento en la tasa de desempleo que siguió al impacto de la pandemia del COVID no se ve reflejado en las otras variables del modelo. Como ejercicio, estime y analice este mismo VAR con datos hasta el segundo trimestre del 2020 (cambiando la siguiente celda); verá que en ese caso el VAR estimado resulta inestable!!
datos = datos[:'2020Q1']
Graficar los datos utilizados#
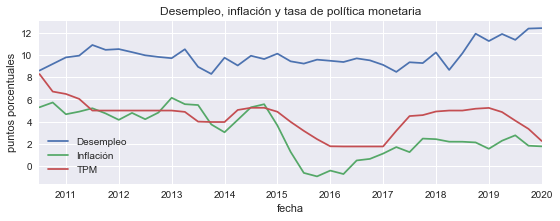
fig, ax = plt.subplots(figsize=[9,3])
datos.plot(ax=ax)
ax.set(title='Desempleo, inflación y tasa de política monetaria', ylabel='puntos porcentuales');
#fig.savefig('VAR-variables.pdf', bbox_inches='tight')
Estimar un VAR#
model = VAR(datos)
res = model.fit(4, ic='bic')
res.summary()
  Summary of Regression Results
==================================
Model:                         VAR
Method:                        OLS
Date:           Thu, 21, Jul, 2022
Time:                     00:20:23
--------------------------------------------------------------------
No. of Equations:         3.00000    BIC:                   -1.30856
Nobs:                     38.0000    HQIC:                  -1.64170
Log likelihood:          -115.071    FPE:                   0.161485
AIC:                     -1.82569    Det(Omega_mle):        0.119601
--------------------------------------------------------------------
Results for equation Desempleo
===============================================================================
                  coefficient       std. error           t-stat            prob
-------------------------------------------------------------------------------
const                2.305139         1.265376            1.822           0.069
L1.Desempleo         0.708084         0.125437            5.645           0.000
L1.Inflación        -0.127880         0.087455           -1.462           0.144
L1.TPM               0.243191         0.124252            1.957           0.050
===============================================================================

Results for equation Inflación
===============================================================================
                  coefficient       std. error           t-stat            prob
-------------------------------------------------------------------------------
const               -0.062525         1.588872           -0.039           0.969
L1.Desempleo        -0.003928         0.157505           -0.025           0.980
L1.Inflación         0.827925         0.109813            7.539           0.000
L1.TPM               0.119255         0.156017            0.764           0.445
===============================================================================

Results for equation TPM
===============================================================================
                  coefficient       std. error           t-stat            prob
-------------------------------------------------------------------------------
const                2.282890         0.964744            2.366           0.018
L1.Desempleo        -0.164187         0.095635           -1.717           0.086
L1.Inflación         0.091391         0.066677            1.371           0.170
L1.TPM               0.753419         0.094732            7.953           0.000
===============================================================================

Correlation matrix of residuals
             Desempleo  Inflación       TPM
Desempleo     1.000000  -0.031396 -0.003364
Inflación    -0.031396   1.000000  0.307269
TPM          -0.003364   0.307269  1.000000
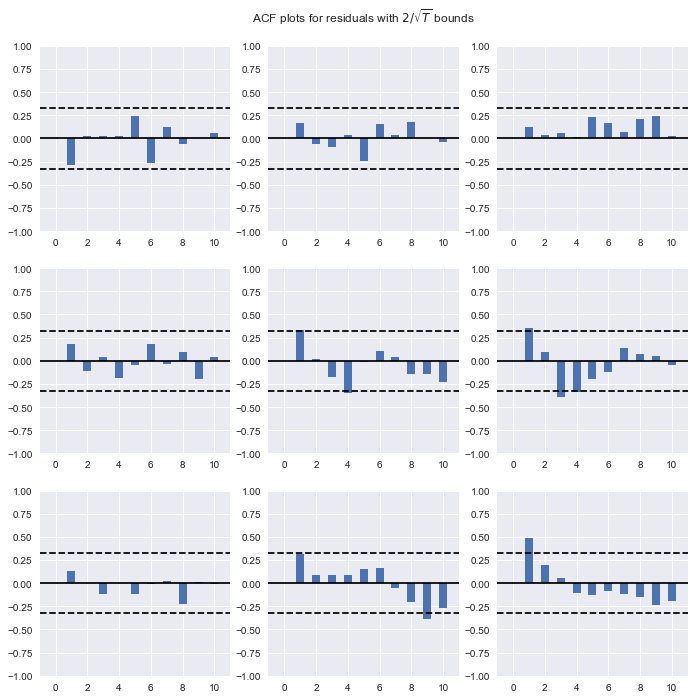
Autocorrelograma de los residuos
res.plot_acorr();
Número óptimo de rezagos para el VAR#
temp = model.select_order(4).summary()
temp
| AIC | BIC | FPE | HQIC | |
|---|---|---|---|---|
| 0 | 1.227 | 1.360 | 3.411 | 1.273 |
| 1 | -1.779 | -1.246* | 0.1693 | -1.595 |
| 2 | -2.121* | -1.188 | 0.1219* | -1.799* |
| 3 | -2.007 | -0.6741 | 0.1411 | -1.547 |
| 4 | -2.002 | -0.2689 | 0.1511 | -1.404 |
Exportar esta tabla a LaTeX
with open('VAR-ic.tex','w') as archivo:
    archivo.write(temp.as_latex_tabular())
Pronosticar las variables#
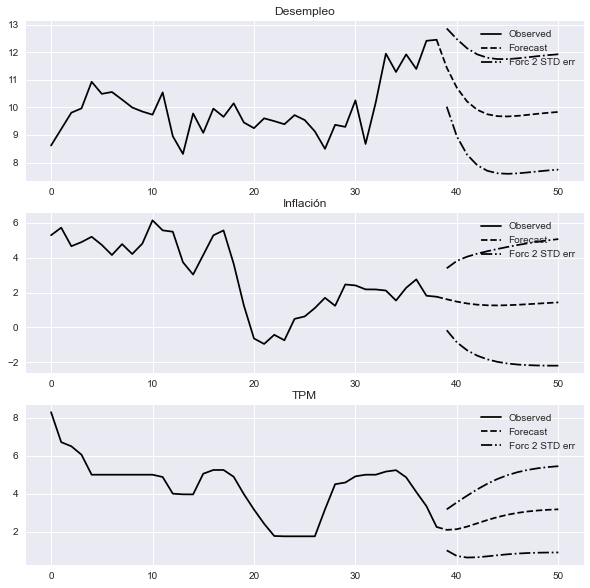
fig = res.plot_forecast(12);
#fig.savefig('VAR-forecast.pdf', bbox_inches='tight')
Analizar las funciones de impulso respuesta#
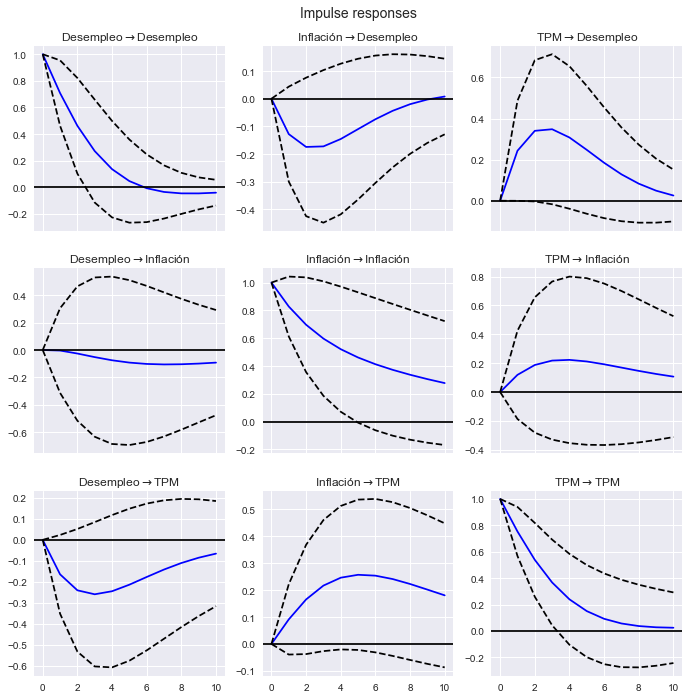
fig = res.irf(10).plot(subplot_params={'figsize':[12,4]});
#fig.savefig('VAR-irf-1.pdf', bbox_inches='tight')
Analizar la descomposición de varianza#
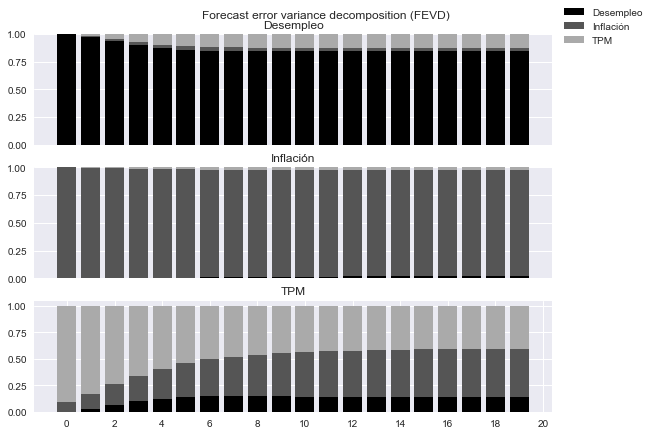
fig=res.fevd(20).plot(figsize=[9,6]);
fig.axes[0].set(xticks=[])
fig.axes[1].set(xticks=[])
fig.axes[2].set(xticks=np.arange(0,21,2))
for ax in fig.axes:
    ax.set(yticks=[0,0.25,0.5,0.75,1.0])

#fig.savefig('VAR-fevd.pdf', bbox_inches='tight')
Estudiar la causalidad de Granger#
granger = pd.DataFrame(np.zeros([3,3]), index = datos.columns.values, columns=datos.columns.values)

for i in datos.columns:
    for j in datos.columns:
        temp = res.test_causality(i, j)
        print(temp.summary())
        granger.loc[j, i] = np.round(temp.pvalue,3)
Granger causality F-test. H_0: Desempleo does not Granger-cause Desempleo. Conclusion: reject H_0 at 5% significance level.
==============================================
Test statistic Critical value p-value    df
----------------------------------------------
         31.87          3.934   0.000 (1, 102)
----------------------------------------------
Granger causality F-test. H_0: Inflación does not Granger-cause Desempleo. Conclusion: fail to reject H_0 at 5% significance level.
==============================================
Test statistic Critical value p-value    df
----------------------------------------------
         2.138          3.934   0.147 (1, 102)
----------------------------------------------
Granger causality F-test. H_0: TPM does not Granger-cause Desempleo. Conclusion: fail to reject H_0 at 5% significance level.
==============================================
Test statistic Critical value p-value    df
----------------------------------------------
         3.831          3.934   0.053 (1, 102)
----------------------------------------------
Granger causality F-test. H_0: Desempleo does not Granger-cause Inflación. Conclusion: fail to reject H_0 at 5% significance level.
==============================================
Test statistic Critical value p-value    df
----------------------------------------------
     0.0006220          3.934   0.980 (1, 102)
----------------------------------------------
Granger causality F-test. H_0: Inflación does not Granger-cause Inflación. Conclusion: reject H_0 at 5% significance level.
==============================================
Test statistic Critical value p-value    df
----------------------------------------------
         56.84          3.934   0.000 (1, 102)
----------------------------------------------
Granger causality F-test. H_0: TPM does not Granger-cause Inflación. Conclusion: fail to reject H_0 at 5% significance level.
==============================================
Test statistic Critical value p-value    df
----------------------------------------------
        0.5843          3.934   0.446 (1, 102)
----------------------------------------------
Granger causality F-test. H_0: Desempleo does not Granger-cause TPM. Conclusion: fail to reject H_0 at 5% significance level.
==============================================
Test statistic Critical value p-value    df
----------------------------------------------
         2.947          3.934   0.089 (1, 102)
----------------------------------------------
Granger causality F-test. H_0: Inflación does not Granger-cause TPM. Conclusion: fail to reject H_0 at 5% significance level.
==============================================
Test statistic Critical value p-value    df
----------------------------------------------
         1.879          3.934   0.173 (1, 102)
----------------------------------------------
Granger causality F-test. H_0: TPM does not Granger-cause TPM. Conclusion: reject H_0 at 5% significance level.
==============================================
Test statistic Critical value p-value    df
----------------------------------------------
         63.25          3.934   0.000 (1, 102)
----------------------------------------------
granger.index.name = 'Explicativa'
granger.columns.name = 'Dependiente'
granger
| Dependiente | Desempleo | Inflación | TPM |
|---|---|---|---|
| Explicativa | |||
| Desempleo | 0.000 | 0.980 | 0.089 |
| Inflación | 0.147 | 0.000 | 0.173 |
| TPM | 0.053 | 0.446 | 0.000 |
granger.to_latex('VAR-Granger-causality.tex', escape=False)
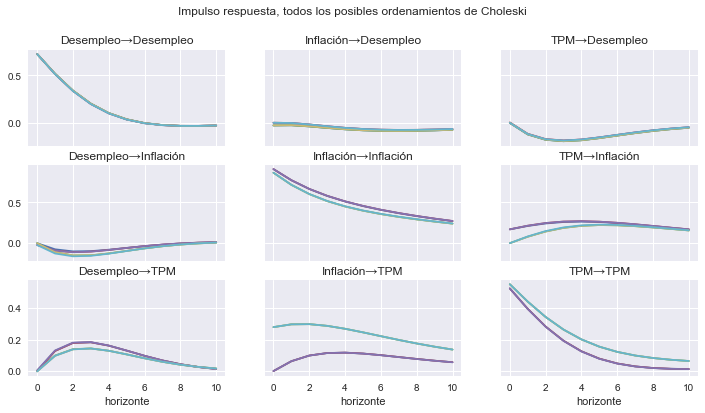
¿Qué tan sensibles son los resultados al ordenamiento de las variables? Estimando todas las combinaciones#
from itertools import permutations
ordenamientos = [x for x in permutations(datos.columns)]
def chol_irf(orden, h=10):
    res = VAR(datos[[*orden]]).fit(1)
    irf = res.irf(h).orth_irfs.flatten()
    idx = pd.MultiIndex.from_product([np.arange(h+1),orden, orden])
    return pd.DataFrame({'→'.join(orden): irf}, index=idx)
irfs = pd.concat([chol_irf(A) for A in ordenamientos], axis=1)
irfs = irfs.stack().unstack(level=[2,1,3])
irfs
| Desempleo | Inflación | TPM | |||||||||||||||||||
|---|---|---|---|---|---|---|---|---|---|---|---|---|---|---|---|---|---|---|---|---|---|
| Desempleo | Desempleo | ... | TPM | TPM | |||||||||||||||||
| Desempleo→Inflación→TPM | Desempleo→TPM→Inflación | Inflación→Desempleo→TPM | Inflación→TPM→Desempleo | TPM→Desempleo→Inflación | TPM→Inflación→Desempleo | Desempleo→Inflación→TPM | Desempleo→TPM→Inflación | Inflación→Desempleo→TPM | Inflación→TPM→Desempleo | ... | Inflación→Desempleo→TPM | Inflación→TPM→Desempleo | TPM→Desempleo→Inflación | TPM→Inflación→Desempleo | Desempleo→Inflación→TPM | Desempleo→TPM→Inflación | Inflación→Desempleo→TPM | Inflación→TPM→Desempleo | TPM→Desempleo→Inflación | TPM→Inflación→Desempleo | |
| 0 | 0.724194 | 0.724194 | 0.723837 | 0.723821 | 0.724189 | 0.723821 | 0.000000 | 0.000000 | -0.022736 | -0.022736 | ... | 0.169655 | 0.169655 | 0.000000 | 0.000000 | 0.525415 | 0.552134 | 0.525415 | 0.525427 | 0.552138 | 0.552138 |
| 1 | 0.515989 | 0.515989 | 0.513381 | 0.512526 | 0.516317 | 0.512526 | -0.074963 | -0.110604 | -0.091126 | -0.091126 | ... | 0.214659 | 0.214659 | 0.079044 | 0.082878 | 0.395858 | 0.441516 | 0.395858 | 0.395082 | 0.441927 | 0.441927 |
| 2 | 0.338887 | 0.338887 | 0.335561 | 0.334373 | 0.339353 | 0.334373 | -0.100606 | -0.150665 | -0.111196 | -0.111196 | ... | 0.247351 | 0.247351 | 0.143155 | 0.148781 | 0.282994 | 0.343617 | 0.282994 | 0.281851 | 0.344219 | 0.344219 |
| 3 | 0.201204 | 0.201204 | 0.198044 | 0.196832 | 0.201687 | 0.196832 | -0.097494 | -0.148945 | -0.103762 | -0.103762 | ... | 0.265491 | 0.265491 | 0.187676 | 0.193762 | 0.192877 | 0.263295 | 0.192877 | 0.191642 | 0.263948 | 0.263948 |
| 4 | 0.102158 | 0.102158 | 0.099593 | 0.098523 | 0.102592 | 0.098523 | -0.080090 | -0.125896 | -0.083258 | -0.083258 | ... | 0.270198 | 0.270198 | 0.213072 | 0.218835 | 0.125788 | 0.200995 | 0.125788 | 0.124620 | 0.201615 | 0.201615 |
| 5 | 0.036303 | 0.036303 | 0.034470 | 0.033610 | 0.036659 | 0.033610 | -0.057790 | -0.094966 | -0.058901 | -0.058901 | ... | 0.264165 | 0.264165 | 0.222396 | 0.227443 | 0.078941 | 0.154777 | 0.078941 | 0.077921 | 0.155321 | 0.155321 |
| 6 | -0.003536 | -0.003536 | -0.004668 | -0.005309 | -0.003263 | -0.005309 | -0.036115 | -0.064193 | -0.035986 | -0.035986 | ... | 0.250521 | 0.250521 | 0.219621 | 0.223820 | 0.048302 | 0.121683 | 0.048302 | 0.047457 | 0.122138 | 0.122138 |
| 7 | -0.024506 | -0.024506 | -0.025054 | -0.025500 | -0.024308 | -0.025500 | -0.017845 | -0.037735 | -0.017067 | -0.017067 | ... | 0.232183 | 0.232183 | 0.208660 | 0.212032 | 0.029701 | 0.098596 | 0.029701 | 0.029025 | 0.098964 | 0.098964 |
| 8 | -0.032811 | -0.032811 | -0.032919 | -0.033207 | -0.032675 | -0.033207 | -0.003965 | -0.017186 | -0.002933 | -0.002933 | ... | 0.211546 | 0.211546 | 0.192856 | 0.195503 | 0.019434 | 0.082704 | 0.019434 | 0.018907 | 0.082993 | 0.082993 |
| 9 | -0.033352 | -0.033352 | -0.033159 | -0.033329 | -0.033263 | -0.033329 | 0.005604 | -0.002588 | 0.006649 | 0.006649 | ... | 0.190395 | 0.190395 | 0.174794 | 0.176848 | 0.014518 | 0.071705 | 0.014518 | 0.014112 | 0.071932 | 0.071932 |
| 10 | -0.029709 | -0.029709 | -0.029334 | -0.029421 | -0.029654 | -0.029421 | 0.011486 | 0.006828 | 0.012413 | 0.012413 | ... | 0.169940 | 0.169940 | 0.156308 | 0.157902 | 0.012733 | 0.063860 | 0.012733 | 0.012420 | 0.064036 | 0.064036 |
11 rows × 54 columns
fig, axs = plt.subplots(3,3, figsize=[12,6], sharex=True, sharey='row')

for i, impulso in enumerate(datos.columns):
    for j, respuesta in enumerate(datos.columns):
        irfs[impulso][respuesta].plot(ax=axs[i,j], legend=False)
        axs[j,i].set_title(impulso + '→' + respuesta )

for ax in axs[-1]:
    ax.set_xlabel('horizonte')

fig.suptitle('Impulso respuesta, todos los posibles ordenamientos de Choleski')
#fig.savefig('VAR-irf-all-orderings.pdf', bbox_inches='tight')
Text(0.5, 0.98, 'Impulso respuesta, todos los posibles ordenamientos de Choleski')
