Series integradas
Contents
4.6. Series integradas#
import numpy as np
import pandas as pd
import matplotlib.pyplot as plt
import statsmodels.formula.api as smf
import statsmodels.api as sm
plt.style.use('seaborn')
plt.rc('figure', figsize=(15,4))
plt.rc('axes', titlesize=20, labelsize=14)
plt.rc('legend', fontsize=14)
plt.rc('xtick', labelsize=14)
plt.rc('ytick', labelsize=14)
plt.rc('savefig', bbox='tight')

figpath = "../figures/"
Simulaciones de caminatas aleatorias#
plt.style.use('seaborn-dark')
pd.options.plotting.backend = "matplotlib"

np.random.seed(2021)

T = 60 # horizonte
n = 100 # cantidad de simulaciones

𝜖 = pd.DataFrame(np.random.randn(T+1, n)) # ruido blanco
y = 𝜖.cumsum(axis=0)  # caminatas aleatorias


fig = plt.figure(figsize=(14, 8))
gs = fig.add_gridspec(5, 2,  width_ratios=(6, 2),
                      left=0.1, right=0.9, bottom=0.1, top=0.9,
                      wspace=0.05, hspace=0.05)

# -----------Graficar las simulaciones
ax = fig.add_subplot(gs[:, 0])
y.plot(color='RoyalBlue', alpha=0.1, legend=False, ax=ax)
ax.axhline(0, color='white');
ax.set(title=f'{n} caminatas aleatorias',ylim=[-25,25])

# -----------Histogramas
ax_last = None
for i in range(5):
    ax_last = fig.add_subplot(gs[i, 1], sharex= ax_last)
    y.loc[15*i].hist(ax=ax_last, color='RoyalBlue', alpha=0.8)
    if i==0:
        ax_last.set(title='Histogramas',xlim=[-25,25])

    ax_last.set_yticks([])
    ax_last.annotate(f't ={15*i}', (0.1, 0.8), xycoords='axes fraction')

fig.savefig(figpath + 'Simulaciones-caminata-aleatoria.pdf')
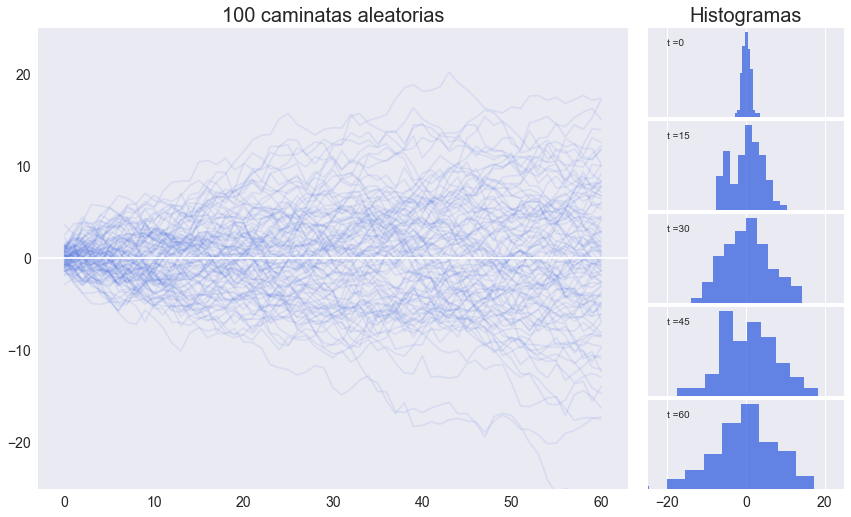
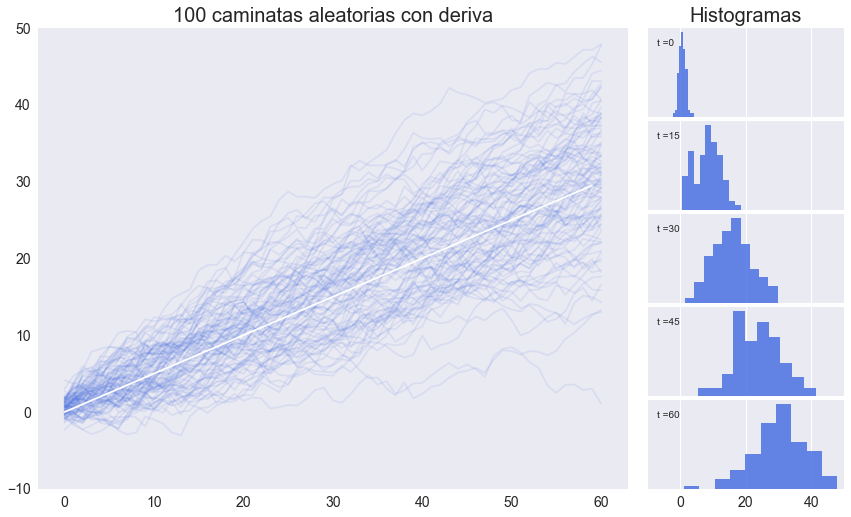
Simulaciones de caminatas aleatorias con deriva#
pd.options.plotting.backend = "matplotlib"
a = 0.5 # deriva
y = (𝜖+a).cumsum(axis=0)  # caminatas aleatorias con deriva


fig = plt.figure(figsize=(14, 8))
gs = fig.add_gridspec(5, 2,  width_ratios=(6, 2),
                      left=0.1, right=0.9, bottom=0.1, top=0.9,
                      wspace=0.05, hspace=0.05)

ax = fig.add_subplot(gs[:, 0])
y.plot(color='RoyalBlue', alpha=0.1, legend=False, ax=ax)
ax.plot(a*np.arange(T), color='white');
ax.set(title=f'{n} caminatas aleatorias con deriva',ylim=[-10,50])

ax_last = None
for i in range(5):
    ax_last = fig.add_subplot(gs[i, 1], sharex= ax_last)
    y.loc[15*i].hist(ax=ax_last, color='RoyalBlue', alpha=0.8)
    if i==0:
        ax_last.set(title='Histogramas',xlim=[-10,50])

    ax_last.set_yticks([])
    ax_last.annotate(f't ={15*i}', (0.05, 0.8), xycoords='axes fraction')

fig.savefig(figpath + 'Simulaciones-caminata-aleatoria-con-deriva.pdf')
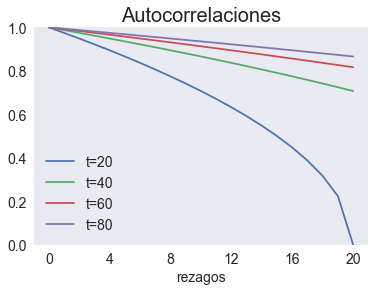
Autocorrelación de una caminata aleatoria#
def rw_rho(t, smax=20):
    """
    Calcula las primera autocorrelaciones de una serie con raiz unitaria

    Ver pagina 56 de los apuntes del tema 4 del curso
    """
    return np.sqrt(1 - np.arange(smax+1) /t)

rw_rho_data = pd.DataFrame({f't={t}':rw_rho(t) for t in [20,40,60,80]})

fig, ax = plt.subplots()
rw_rho_data.plot(ax=ax)
ax.set(ylim=[0,1], xticks=np.arange(0,21,4), xlabel='rezagos', title='Autocorrelaciones')
plt.savefig(figpath + 'rw-rho.pdf', bbox_inches='tight')
Estacionario en diferencia vs estacionario en tendencia#
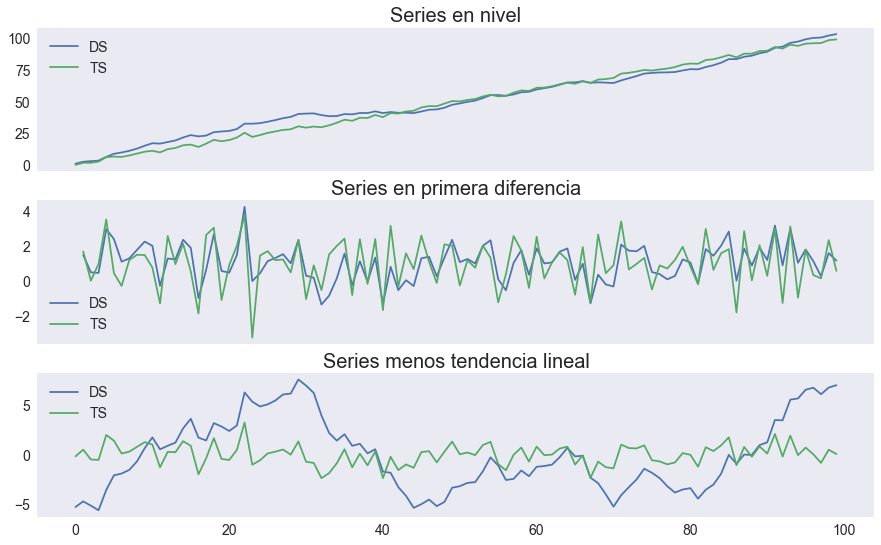
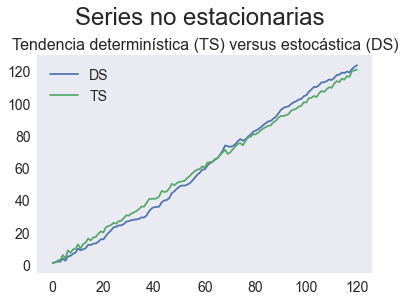
Ejemplo basado en Levendis 2019, pp. 109-113. Muestra que no es tan fácil distinguir a simple vista un proceso estacionario en diferencia de uno estacionario alrededor de una tendencia.
T = 100
np.random.seed(12345)
tt = np.arange(T)
e = np.random.randn(T)
datos = pd.DataFrame({'t':tt, 'e':e}, index=tt)
datos['DS'] = (1+e).cumsum()
datos['TS'] = 1*tt + e
datos
| t | e | DS | TS | |
|---|---|---|---|---|
| 0 | 0 | -0.204708 | 0.795292 | -0.204708 |
| 1 | 1 | 0.478943 | 2.274236 | 1.478943 |
| 2 | 2 | -0.519439 | 2.754797 | 1.480561 |
| 3 | 3 | -0.555730 | 3.199067 | 2.444270 |
| 4 | 4 | 1.965781 | 6.164847 | 5.965781 |
| ... | ... | ... | ... | ... |
| 95 | 95 | 0.795253 | 99.254214 | 95.795253 |
| 96 | 96 | 0.118110 | 100.372324 | 96.118110 |
| 97 | 97 | -0.748532 | 100.623793 | 96.251468 |
| 98 | 98 | 0.584970 | 102.208762 | 98.584970 |
| 99 | 99 | 0.152677 | 103.361439 | 99.152677 |
100 rows × 4 columns
%%timeit
lento = pd.DataFrame({'t':tt, 'e':e}, index=tt)

# caminata aleatoria
y = np.zeros(T)
y[0] = 1 + e[0]
for t in range(1, T):
    y[t] = 1 + y[t-1] + e[t]

# estacionario alrededor de tendencia
x = np.zeros(T)
x[0] = e[0]
for t in range(1, T):
    x[t] = 1 * tt[t] + e[t]

lento['y'] = y
lento['x'] = x
#lento
2.27 ms ± 373 µs per loop (mean ± std. dev. of 7 runs, 100 loops each)
detrended = pd.DataFrame(
    {'DS':smf.ols('DS ~ t', datos).fit().resid,
     'TS':smf.ols('TS ~ t', datos).fit().resid
    }, index=tt)
def ols_ala_stata(formula):
    return smf.ols(formula, datos).fit().summary()
ols_ala_stata('DS ~ t + TS -1')
| Dep. Variable: | DS | R-squared (uncentered): | 0.993 |
|---|---|---|---|
| Model: | OLS | Adj. R-squared (uncentered): | 0.993 |
| Method: | Least Squares | F-statistic: | 7233. |
| Date: | Thu, 21 Jul 2022 | Prob (F-statistic): | 3.71e-107 |
| Time: | 00:12:21 | Log-Likelihood: | -297.34 |
| No. Observations: | 100 | AIC: | 598.7 |
| Df Residuals: | 98 | BIC: | 603.9 |
| Df Model: | 2 | ||
| Covariance Type: | nonrobust |
| coef | std err | t | P>|t| | [0.025 | 0.975] | |
|---|---|---|---|---|---|---|
| t | 0.4261 | 0.463 | 0.921 | 0.359 | -0.492 | 1.344 |
| TS | 0.5768 | 0.462 | 1.248 | 0.215 | -0.340 | 1.494 |
| Omnibus: | 17.306 | Durbin-Watson: | 0.027 |
|---|---|---|---|
| Prob(Omnibus): | 0.000 | Jarque-Bera (JB): | 6.610 |
| Skew: | 0.374 | Prob(JB): | 0.0367 |
| Kurtosis: | 1.986 | Cond. No. | 111. |
Notes:
[1] R² is computed without centering (uncentered) since the model does not contain a constant.
[2] Standard Errors assume that the covariance matrix of the errors is correctly specified.
fig, axs = plt.subplots(3,1, figsize=[15,9], sharex=True)
series = ['DS', 'TS']
datos[series].plot(ax=axs[0], title='Series en nivel')
datos[series].diff().plot(ax=axs[1], title='Series en primera diferencia')
detrended[series].plot(ax=axs[2], title='Series menos tendencia lineal')
<AxesSubplot:title={'center':'Series menos tendencia lineal'}>
np.random.seed(1)
T = 121
e = np.random.randn(T)
e[0] = 0

x0 = y0 = a = 1
t = np.arange(T)

y = y0 + a*t + e.cumsum()
x = x0 + a*t + e

ejemplo = pd.DataFrame({'DS':y,'TS':x})

fig, ax = plt.subplots()
ejemplo.plot(ax=ax)
ax.set_title('Tendencia determinística (TS) versus estocástica (DS)', fontsize=16)
fig.suptitle('Series no estacionarias',fontsize=24, y=1.05)
fig.savefig(figpath + 'TS-DS-sample.pdf')
Repetimos el ejercicio, pero con un millón de observaciones
T = 1_000_000
np.random.seed(12345)
tt = np.arange(T)
e = np.random.randn(T)
big = pd.DataFrame({'t':tt, 'e':e}, index=tt)
big['DS'] = (1+e).cumsum()
big['TS'] = tt + e

bigdetrended = pd.DataFrame(
    {'DS':smf.ols('DS~t', big).fit().resid,
     'TS':smf.ols('TS~t', big).fit().resid
    }, index=tt)

resumen = pd.concat([
    big[series].diff().describe().T,
    bigdetrended[series].describe().T
], keys=['1-diff', '- tend'])

resumen
| count | mean | std | min | 25% | 50% | 75% | max | ||
|---|---|---|---|---|---|---|---|---|---|
| 1-diff | DS | 999999.0 | 1.001494e+00 | 0.999954 | -4.057590 | 0.326730 | 1.001364 | 1.674426 | 5.979780 |
| TS | 999999.0 | 1.000001e+00 | 1.414065 | -5.800262 | 0.046267 | 1.000069 | 1.951536 | 7.517358 | |
| - tend | DS | 1000000.0 | -3.559082e-09 | 158.846292 | -405.803718 | -118.686166 | -15.663626 | 136.408845 | 372.938439 |
| TS | 1000000.0 | 6.236537e-10 | 0.999953 | -5.058701 | -0.674670 | -0.000123 | 0.672972 | 4.978591 |


