Pruebas de raíz unitaria para el PIB en Costa Rica
Contents
4.5. Pruebas de raíz unitaria para el PIB en Costa Rica#
import numpy as np
import pandas as pd
import matplotlib.pyplot as plt
import statsmodels.formula.api as smf
import statsmodels.api as sm
from statsmodels.tsa.stattools import adfuller, kpss
plt.style.use('seaborn')
plt.rc('figure', figsize=(15,4))
plt.rc('axes', titlesize=20, labelsize=14)
plt.rc('legend', fontsize=14)
plt.rc('xtick', labelsize=14)
plt.rc('ytick', labelsize=14)

figpath = "../figures/"
Descargar los datos#
import bccr
pib = bccr.SW(PIB=33783)
pib['lPIB'] = np.log(pib['PIB'])

temp = pib.copy()
temp.index = pib.index.to_series().astype(str)
temp.reset_index().to_stata('pib-costa-rica.dta')
del temp
Gráfico de la serie#
fig, ax = plt.subplots()
pib['PIB'].plot(ax=ax, legend=False)
ax.set(yscale='log', title='Producto interno bruto de Costa Rica', ylabel='escala logarítmica')
fig.savefig(figpath + 'pib-costa-rica-I(1).pdf', bbox_inches='tight')

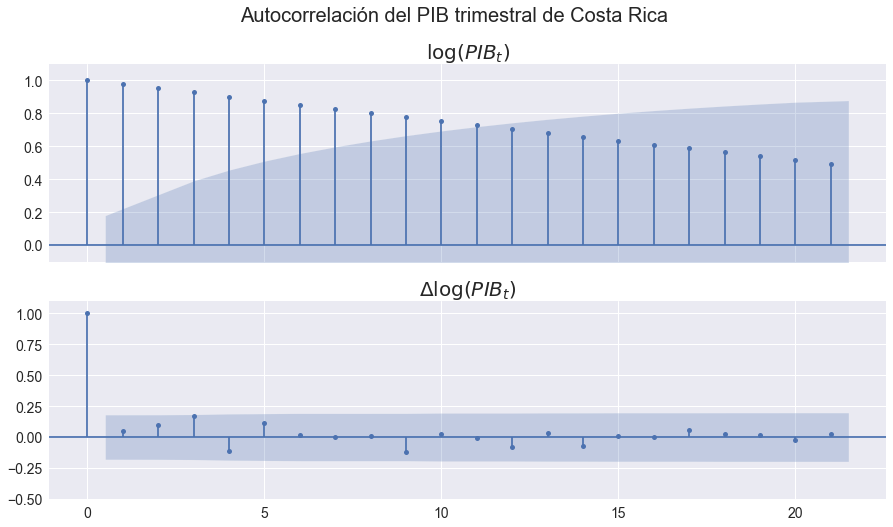
Correlograma del (logaritmo) del PIB y su primer diferencia#
fig,axs = plt.subplots(2,1, figsize=[15,8], sharex=True)
sm.graphics.tsa.plot_acf(pib['lPIB'],ax=axs[0]);
axs[0].set(ylim=[-0.1,1.1], title='$\log(PIB_t)$')

sm.graphics.tsa.plot_acf(pib['lPIB'].diff().dropna(),ax=axs[1]);
axs[1].set(ylim=[-0.5,1.1], title='$\Delta\log(PIB_t)$')

fig.suptitle('Autocorrelación del PIB trimestral de Costa Rica', fontsize=20)
fig.savefig(figpath + 'pib-costa-rica-rho.pdf',bbox_inches='tight')

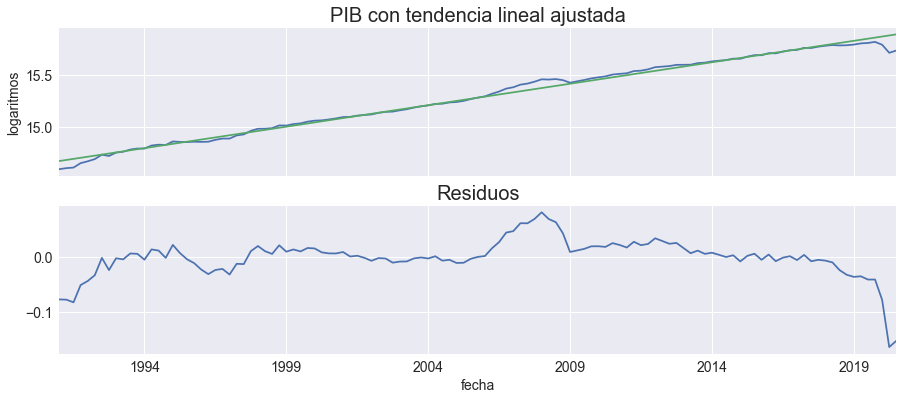
Ajustando una tendencia lineal#
Estimando la tendencia y los residuos#
pib['t'] = np.arange(pib.shape[0])

pib['tendencia'] = smf.ols('lPIB ~ t', pib).fit().fittedvalues
pib['residuos'] = pib['lPIB'] - pib['tendencia']
fig, axs = plt.subplots(2,1, figsize=[15,6], sharex=True)
pib[['lPIB','tendencia']].plot(ax=axs[0], legend=False)
axs[0].set(title='PIB con tendencia lineal ajustada', ylabel='logaritmos')

pib[['residuos']].plot(ax=axs[1], legend=False)
axs[1].set(title='Residuos')
fig.savefig(figpath + 'pib-tendencia-lineal.pdf', bbox_inches='tight')

Correlograma de los residuos#
sm.graphics.tsa.plot_acf(pib['residuos']);

Pruebas de DickeyFuller#
Implementando la prueba DF con regresión lineal#
dy  = pib['lPIB'].diff()[1:]
ly = pib['lPIB'].shift(1)[1:]
tt = np.arange(dy.size)

X = sm.add_constant(ly)
Z = np.c_[X,tt]
tnc = sm.OLS(dy,ly, hasconst=False).fit().tvalues[0]
tc = sm.OLS(dy, X, hasconst=True).fit().tvalues[1]
tct = sm.OLS(dy, Z, hasconst=True).fit().tvalues[1]
tnc, tc, tct
(7.591019301133945, -2.8373335086898184, -0.1961570690538992)
tbl = sm.OLS(dy, X, hasconst=True).fit().summary().tables[1]

with open(figpath + 'df-lpib-regresion.tex','w') as cuadro:
    cuadro.write(tbl.as_latex_tabular())
Implementando el código para hacer las tablas#
specs = ['nc', 'c', 'ct']
indice = ['sin constante', 'con constante', 'con constante y tendencia']

def DF(datos, spec):
    res = adfuller(datos, maxlag=0,regression=spec)
    resultado = {
        'z':res[0],
        '1%': res[4]['1%'],
        '5%': res[4]['5%'],
        '10%': res[4]['10%']}
    return resultado

def ADF(datos, spec):
    res = adfuller(datos, regression=spec, autolag='t-stat')
    resultado = {
        'z':res[0],
        '1%': res[4]['1%'],
        '5%': res[4]['5%'],
        '10%': res[4]['10%'],
        'p': res[2]}
    return resultado

pruebas = {'df':DF, 'adf':ADF}

def tabla_dickey_fuller(serie, test, diff=0):
    datos = pib[serie].diff(diff) if diff else pib[serie]
    resultados = pd.DataFrame([pruebas[test](datos.dropna(), ss) for ss in specs], index=indice).round(3)
    nombre = '_'.join([test,serie,str(diff)])
    resultados.to_latex(figpath + nombre + '.tex')
    return resultados
Pruebas para serie en nivel#
tabla_dickey_fuller('lPIB','df')
| z | 1% | 5% | 10% | |
|---|---|---|---|---|
| sin constante | 7.591 | -2.585 | -1.943 | -1.615 |
| con constante | -2.837 | -3.487 | -2.886 | -2.580 |
| con constante y tendencia | -0.196 | -4.038 | -3.448 | -3.149 |
Pruebas para serie en primer diferencia#
tabla_dickey_fuller('lPIB', 'df', diff=1)
| z | 1% | 5% | 10% | |
|---|---|---|---|---|
| sin constante | -7.289 | -2.585 | -1.944 | -1.615 |
| con constante | -10.191 | -3.488 | -2.887 | -2.580 |
| con constante y tendencia | -10.859 | -4.038 | -3.449 | -3.149 |
Serie de los residuos alrededor de tendencia#
tabla_dickey_fuller('residuos', 'df', diff=0)
| z | 1% | 5% | 10% | |
|---|---|---|---|---|
| sin constante | -0.408 | -2.585 | -1.943 | -1.615 |
| con constante | -0.386 | -3.487 | -2.886 | -2.580 |
| con constante y tendencia | -0.196 | -4.038 | -3.448 | -3.149 |
Prueba aumentada de Dickey-Fuller#
Serie en nivel#
tabla_dickey_fuller('lPIB', 'adf', diff=0)
| z | 1% | 5% | 10% | p | |
|---|---|---|---|---|---|
| sin constante | 2.405 | -2.586 | -1.944 | -1.615 | 4 |
| con constante | -2.080 | -3.492 | -2.888 | -2.581 | 9 |
| con constante y tendencia | 0.605 | -4.044 | -3.452 | -3.151 | 9 |
Serie en primer diferencia#
tabla_dickey_fuller('lPIB', 'adf', diff=1)
| z | 1% | 5% | 10% | p | |
|---|---|---|---|---|---|
| sin constante | -2.247 | -2.585 | -1.944 | -1.615 | 2 |
| con constante | -2.663 | -3.492 | -2.888 | -2.581 | 8 |
| con constante y tendencia | -3.338 | -4.044 | -3.452 | -3.151 | 8 |
Serie de los residuos alrededor de tendencia#
tabla_dickey_fuller('residuos', 'adf', diff=0)
| z | 1% | 5% | 10% | p | |
|---|---|---|---|---|---|
| sin constante | -0.211 | -2.587 | -1.944 | -1.615 | 9 |
| con constante | 0.061 | -3.492 | -2.888 | -2.581 | 9 |
| con constante y tendencia | 0.605 | -4.044 | -3.452 | -3.151 | 9 |
Pruebas KPSS#
def KPSS_una_serie(datos, tipo):
    return [kpss(datos.dropna(), regression=tipo, lags=k)[0] for k in range(7)]
critical = pd.DataFrame(
    {'c': np.array([0.347, 0.463, 0.574, 0.739]),
     'ct':np.array([0.119, 0.146, 0.176, 0.216])},
    index=['10%', '5%', '2.5%', '1%'])
def tabla_KPSS(diff=0):
    datos = pib['lPIB'].diff(diff) if diff else pib['lPIB']
    resultados = pd.DataFrame([KPSS_una_serie(datos, ss) for ss in ['c','ct']], index=['c','ct']).round(3)
    #nombre = '_'.join([test,serie,str(diff)])
    #resultados.to_latex(figpath + nombre + '.tex')
    return resultados.T
%%capture
tab = pd.concat([tabla_KPSS(diff=r) for r in range(2)], axis=1,keys=['nivel','diferencia'])
tab.to_latex(figpath + 'kpss_lPIB.tex')
tab
| nivel | diferencia | |||
|---|---|---|---|---|
| c | ct | c | ct | |
| 0 | 11.868 | 1.261 | 0.710 | 0.100 |
| 1 | 6.005 | 0.692 | 0.678 | 0.103 |
| 2 | 4.040 | 0.502 | 0.630 | 0.100 |
| 3 | 3.058 | 0.405 | 0.568 | 0.092 |
| 4 | 2.468 | 0.347 | 0.555 | 0.093 |
| 5 | 2.076 | 0.308 | 0.531 | 0.091 |
| 6 | 1.795 | 0.280 | 0.514 | 0.090 |
critical.to_latex(figpath + 'kpss_critical.tex')


